In today’s data-driven world, Power BI and Excel are two of the most widely used tools for data analysis, reporting, and business intelligence. While both come from Microsoft, they serve different purposes and are designed for different types of users. If you’re wondering which tool is better for data visualization, reporting, and business intelligence, this article will help you decide.
Let’s compare Power BI vs Excel in terms of features, advantages, and real-world applications.
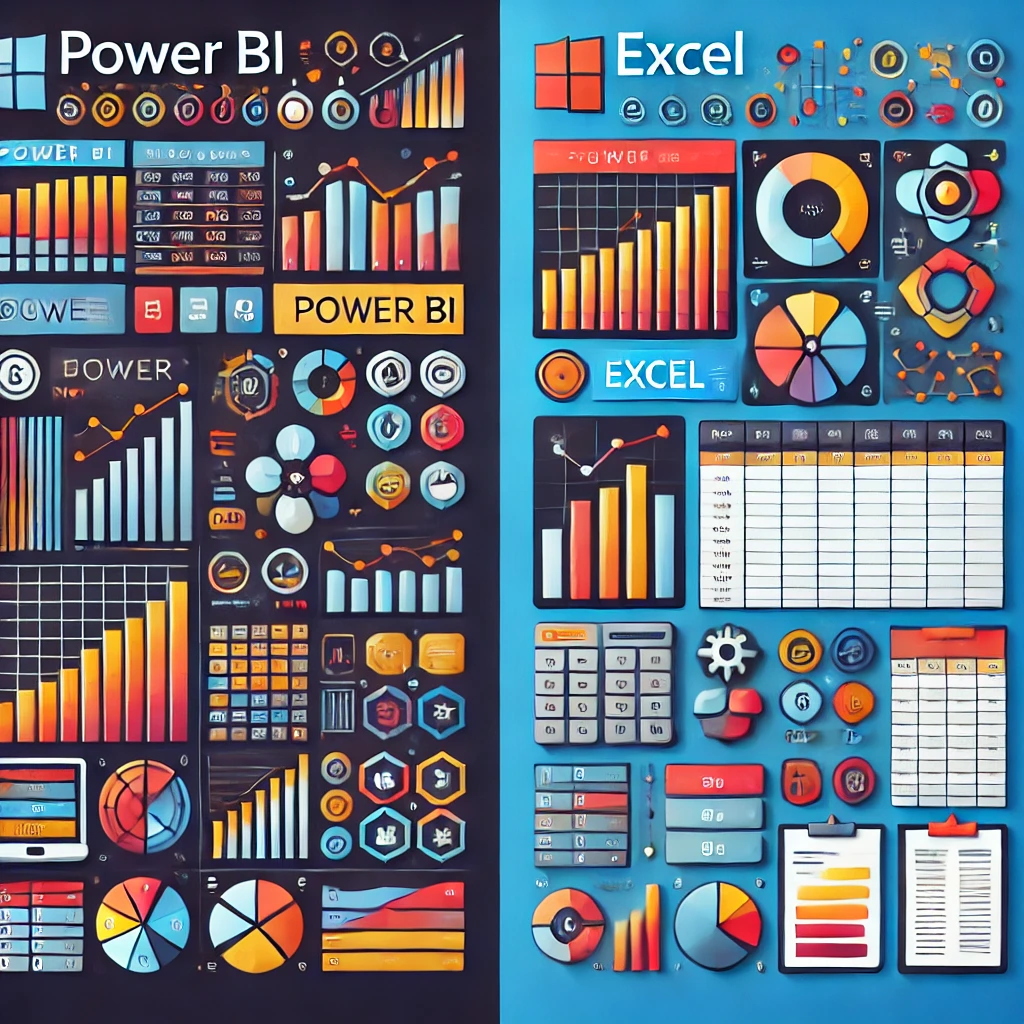
1. What is Power BI?
Power BI is a business intelligence (BI) and data visualization tool that allows users to connect, analyze, and share insights from various data sources. It is designed to handle large datasets and offers interactive dashboards, AI-driven analytics, and real-time data updates.
Key Features of Power BI:
✔ Data Connectivity: Connects to multiple sources (SQL, Excel, APIs, cloud platforms).
✔ Advanced Visualization: Provides interactive dashboards and dynamic reports.
✔ Real-time Data Updates: Automatically refreshes and updates reports.
✔ Cloud & Collaboration: Share reports with teams using Power BI Service.
✔ Security & Governance: Offers Row-Level Security (RLS) and role-based access.
2. What is Excel?
Excel is a spreadsheet tool that helps users perform calculations, organize data, and create basic reports. It is widely used for small-scale data analysis, financial modeling, and automation with VBA.
Key Features of Excel:
✔ Formula-Based Calculations: Supports thousands of built-in functions.
✔ Pivot Tables & Charts: Analyzes data using tables and graphs.
✔ Data Cleaning: Power Query helps transform raw data.
✔ Automation: VBA (Visual Basic for Applications) allows task automation.
✔ Offline Usability: Works without an internet connection.
3. Power BI vs Excel: Feature-by-Feature Comparison
| Feature | Power BI | Excel |
|---|---|---|
| Data Size Handling | Handles millions of rows efficiently | Limited to 1,048,576 rows per sheet |
| Visualization | Interactive dashboards with drag-and-drop options | Basic charts and pivot tables |
| Real-Time Data | Supports live data streaming | Requires manual refresh |
| Data Sources | Connects to databases, APIs, cloud services, Excel | Works primarily with structured spreadsheets |
| Collaboration | Cloud-based sharing via Power BI Service | File-based sharing via email, OneDrive |
| Automation | Uses DAX (Data Analysis Expressions) and Power Query | Uses VBA and Macros |
| Security | Role-based access control (RLS) | Basic file protection with passwords |
| Learning Curve | Requires some knowledge of DAX and Power Query | Easier for beginners |
4. When to Use Power BI?
Power BI is the best choice when:
✔ You work with large datasets that exceed Excel’s limit.
✔ You need real-time, interactive dashboards.
✔ You require AI-powered insights and automation.
✔ You want to collaborate with teams and share reports online.
✔ You need strong security features like Row-Level Security (RLS).
Best Use Cases for Power BI:
- Enterprise-Level Business Intelligence
- Real-Time Data Monitoring
- Sales and Financial Reporting
- Data Integration from Multiple Sources
5. When to Use Excel?
Excel is the best choice when:
✔ You need to perform quick calculations using formulas.
✔ Your data fits within 1 million rows.
✔ You prefer a simple, offline tool for analysis.
✔ You need manual control over datasets.
✔ You use VBA for automation.
Best Use Cases for Excel:
- Budgeting and Financial Modeling
- Small-Scale Data Analysis
- Basic Reporting and Charts
- Personal Productivity and Data Storage
6. Can Power BI and Excel Work Together?
Yes! Power BI and Excel are designed to complement each other. You can:
- Import Excel data into Power BI for advanced visualization.
- Use Power Query in both tools to clean and transform data.
- Export Power BI reports to Excel for further analysis.
💡 Many organizations use Power BI for dashboards and Excel for calculations and data storage.
7. Conclusion: Power BI or Excel – Which One Should You Choose?
| Choose Power BI If: | Choose Excel If: |
|---|---|
| You need interactive dashboards and real-time insights. | You need a simple spreadsheet for calculations. |
| You work with large datasets from multiple sources. | You work with structured, small datasets. |
| You want advanced AI-driven analytics. | You prefer manual data control and offline access. |
| You need strong security features like RLS. | You use VBA for automation. |
| You want collaborative, cloud-based reporting. | You need a quick, ad-hoc data analysis tool. |
Final Verdict: If you need business intelligence and data visualization, Power BI is the best choice. However, for spreadsheet-based calculations and small data analysis tasks, Excel remains useful.
💡 For maximum efficiency, many professionals use both Power BI and Excel together!
8. FAQs: Power BI vs Excel
Q1: Is Power BI harder to learn than Excel?
Power BI has a steeper learning curve because it requires knowledge of DAX, Power Query, and data modeling. However, with practice, it becomes easy to use.
Q2: Can I use Power BI without Excel?
Yes, Power BI works independently and can pull data from databases, cloud sources, APIs, and online services. However, many users still import Excel files into Power BI.
Q3: Is Power BI free?
Power BI Desktop is free, but Power BI Pro and Premium (for sharing and collaboration) require a paid subscription.
Q4: Can Excel handle big data like Power BI?
No, Excel has a row limit and struggles with large datasets. Power BI is optimized for big data analysis and handles millions of rows efficiently.


